General Procedure
- Enter or upload equilbrium data
- Select component, then enter/upload tie-line data
- If necessary, alter extract/raffinate ranges (press set ranges to update graph)
- View ternary plot (options: toggle axis, add points, change theme, download)
- View right triangular plot (options: toggle axis, choose components, add points, change theme, download, plot.ly)
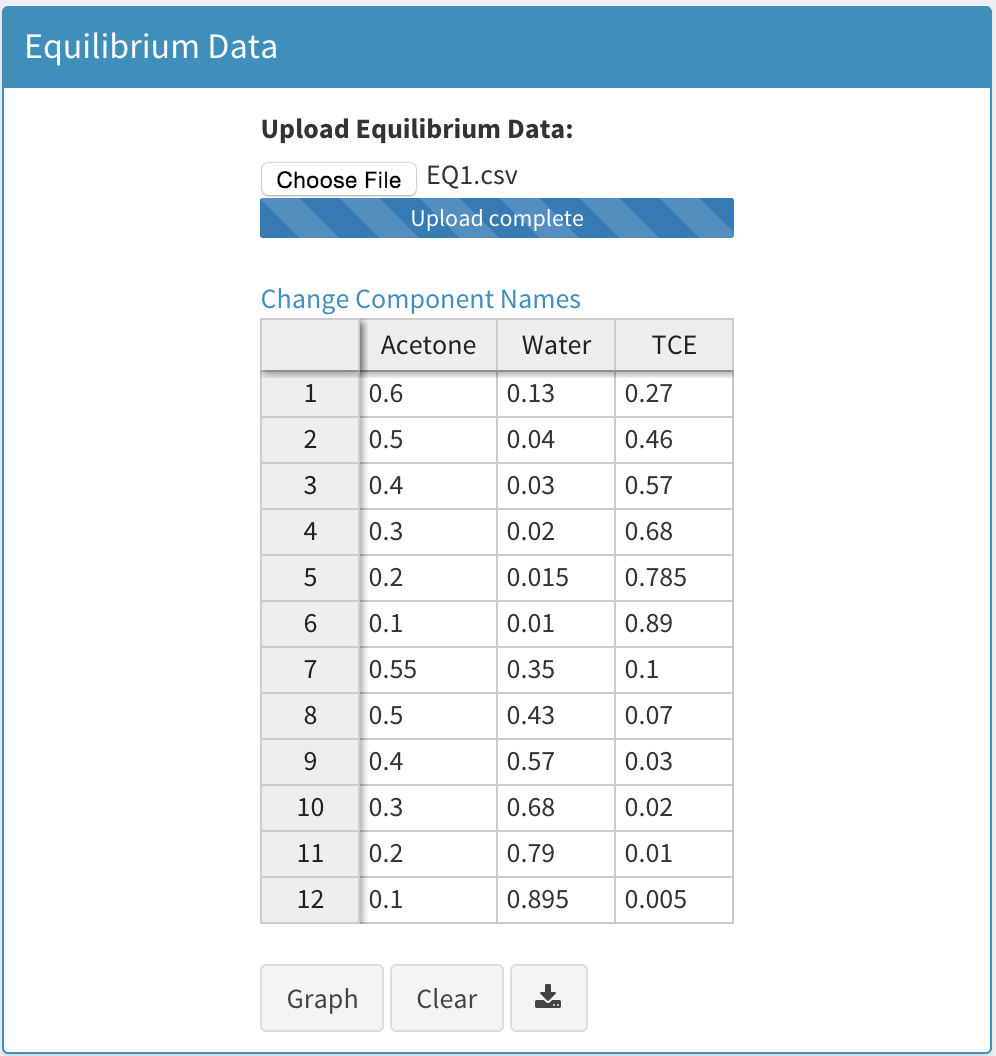
Equilibrium Data
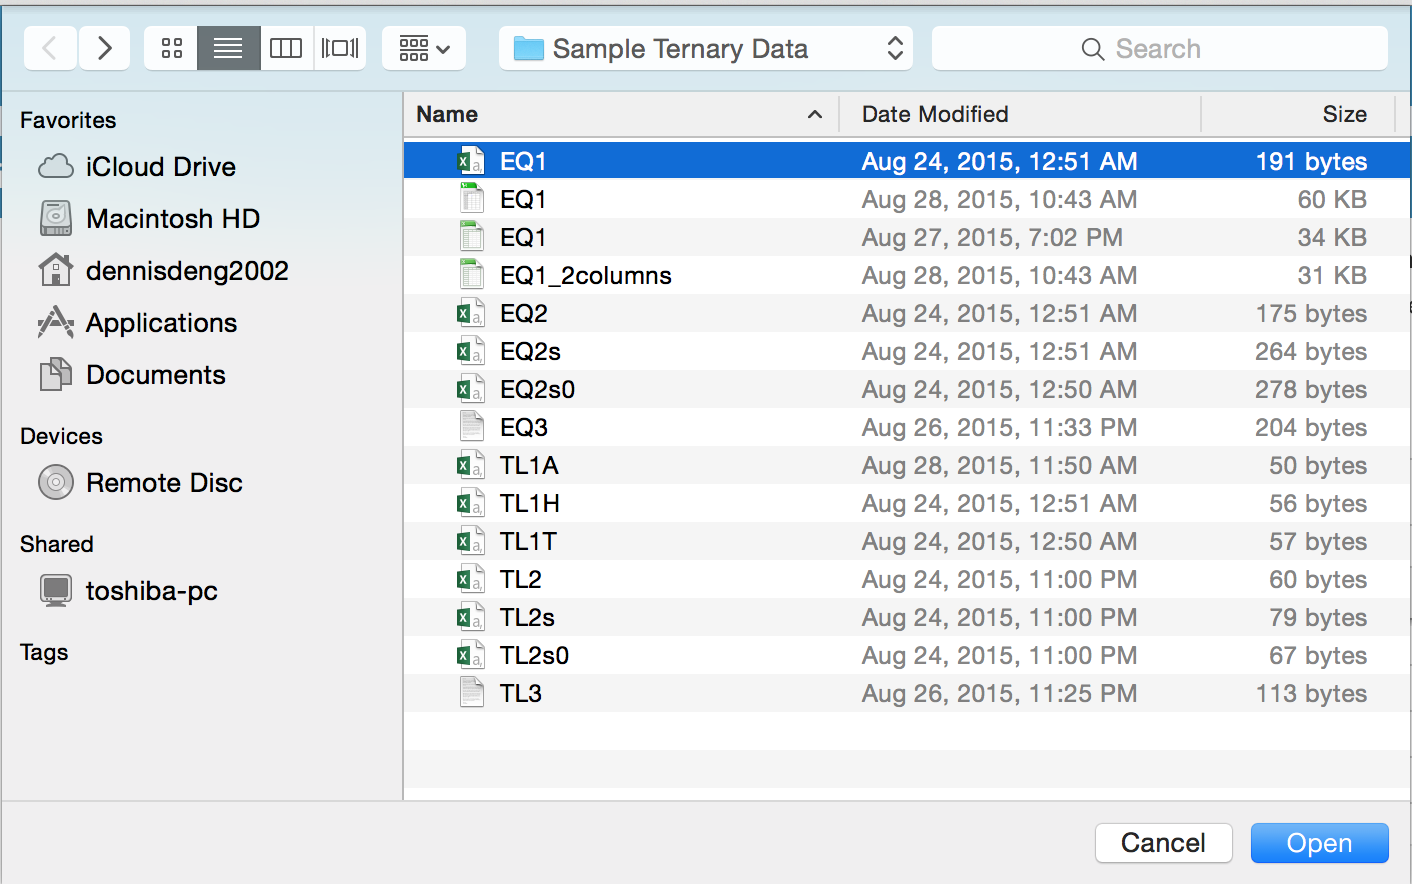
- Accepted file types include .csv, .tsv, .txt, .xls (doesn't work in Chrome), and .xlsx (rtf files must be converted to plain text)
- Table options can be accessed by right clicking a cell
- First row of uploaded data must be your component names
- For .txt files the default delimiter is a space (make sure there aren't any hanging spaces at the end of rows)
- Commas, semicolons, and tabs are also accepted as delimiters, and you will be prompted to select the delimiter and reupload the data
- If only two data columns are given the third will be calculated (summation = 1)
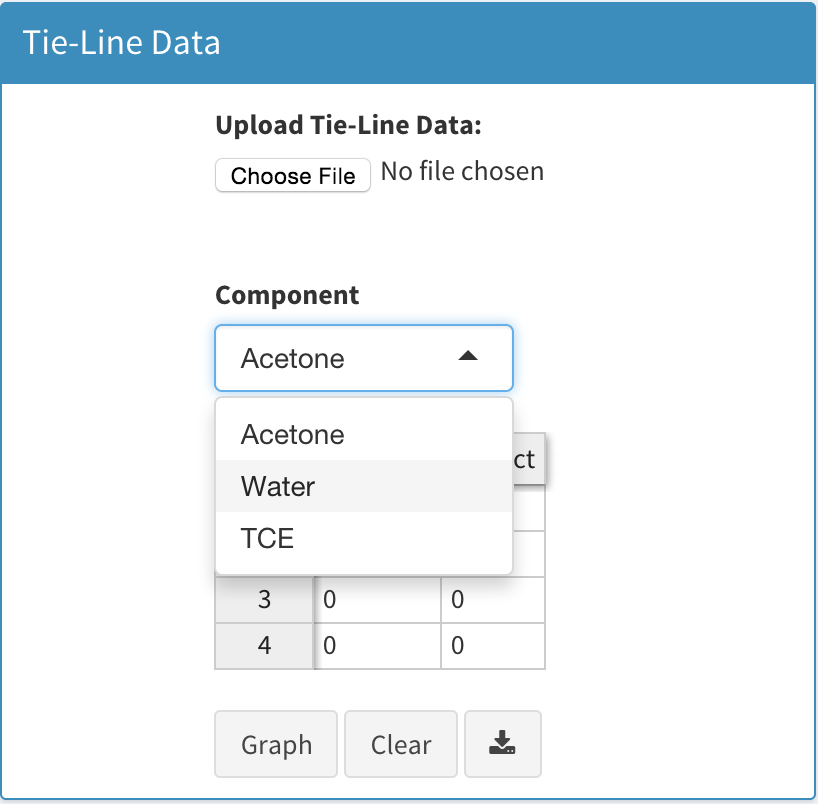
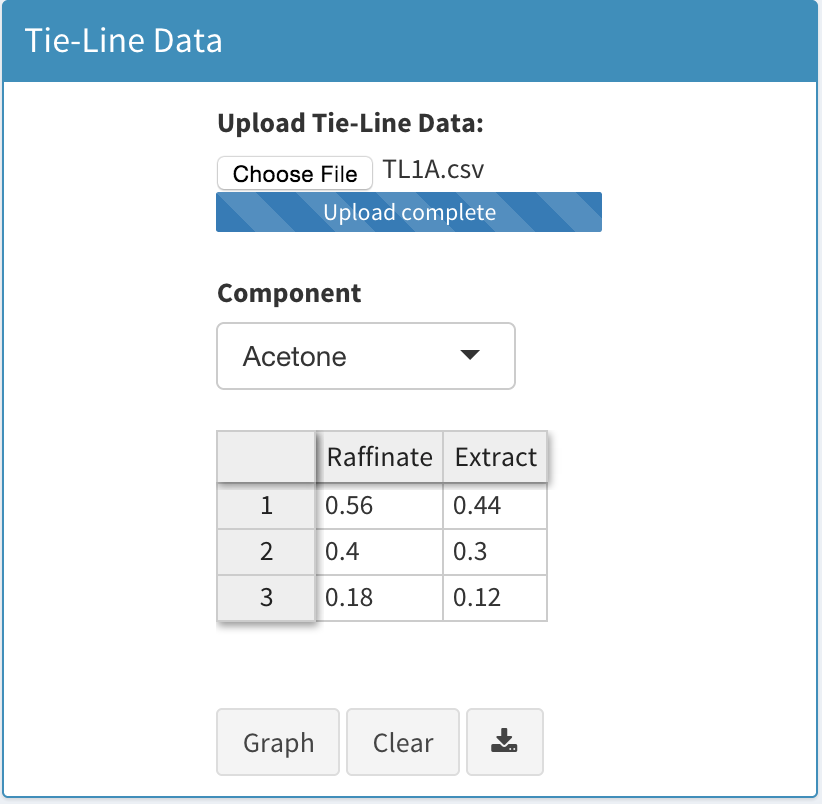
Tie-Line Data
- Uploading or entering tie-line data without equilibrium data will result in an error.
- Tie-line data should be entered using a single component for both extract and raffinate
- Actual data points (all three coordinates) will be calculated using a linear interpolation method
- Errors in interpolation generally occur due to incorrectly set ranges (next section), and an alert will be prompted if interpolated values are zero or negative
- Graph button is used to commit any changes in tie-line data or component choice and update plots
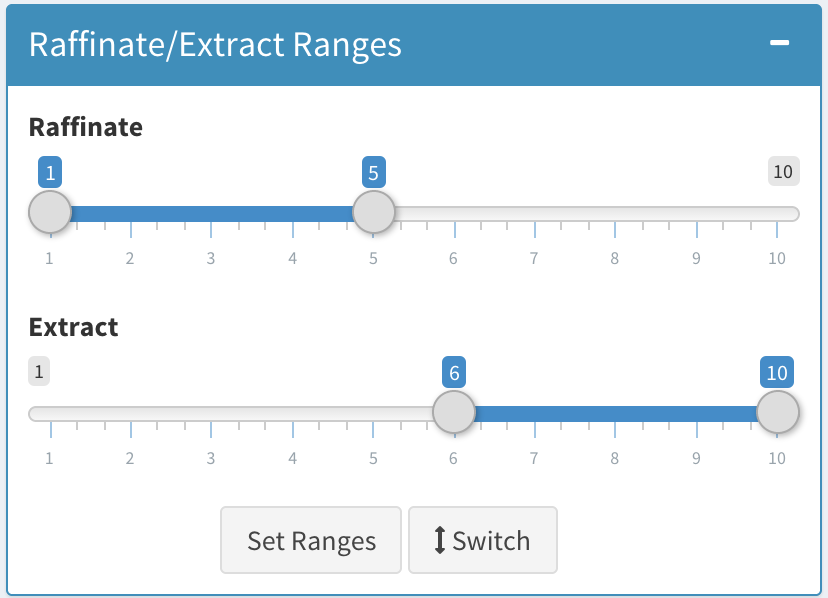
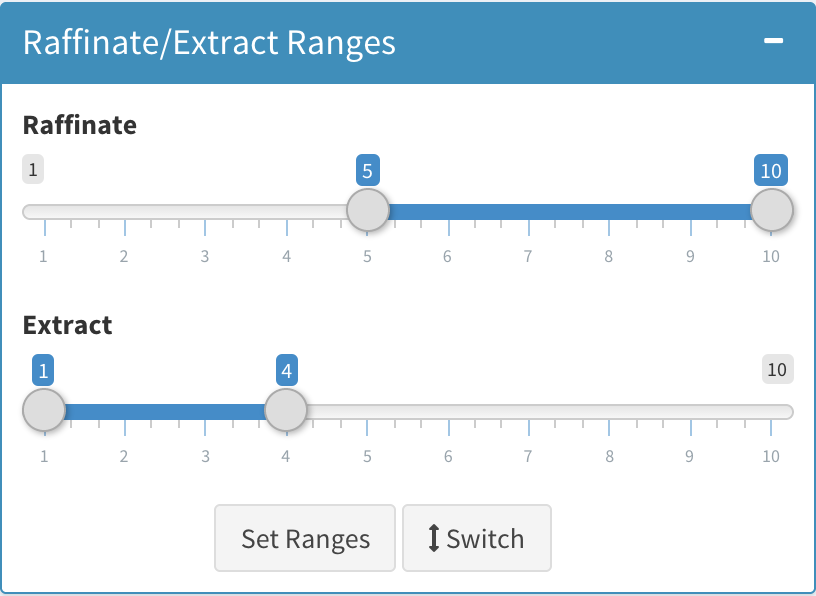
Ranges
- Initial ranges are automatically calculated (equilibrium data is assumed symmetrical)
- Plots will only update when the set ranges button is pressed (pressing switch button therefore will not update plots)
- Ranges are programmed to sum up to the number of rows given in the equilibrium data
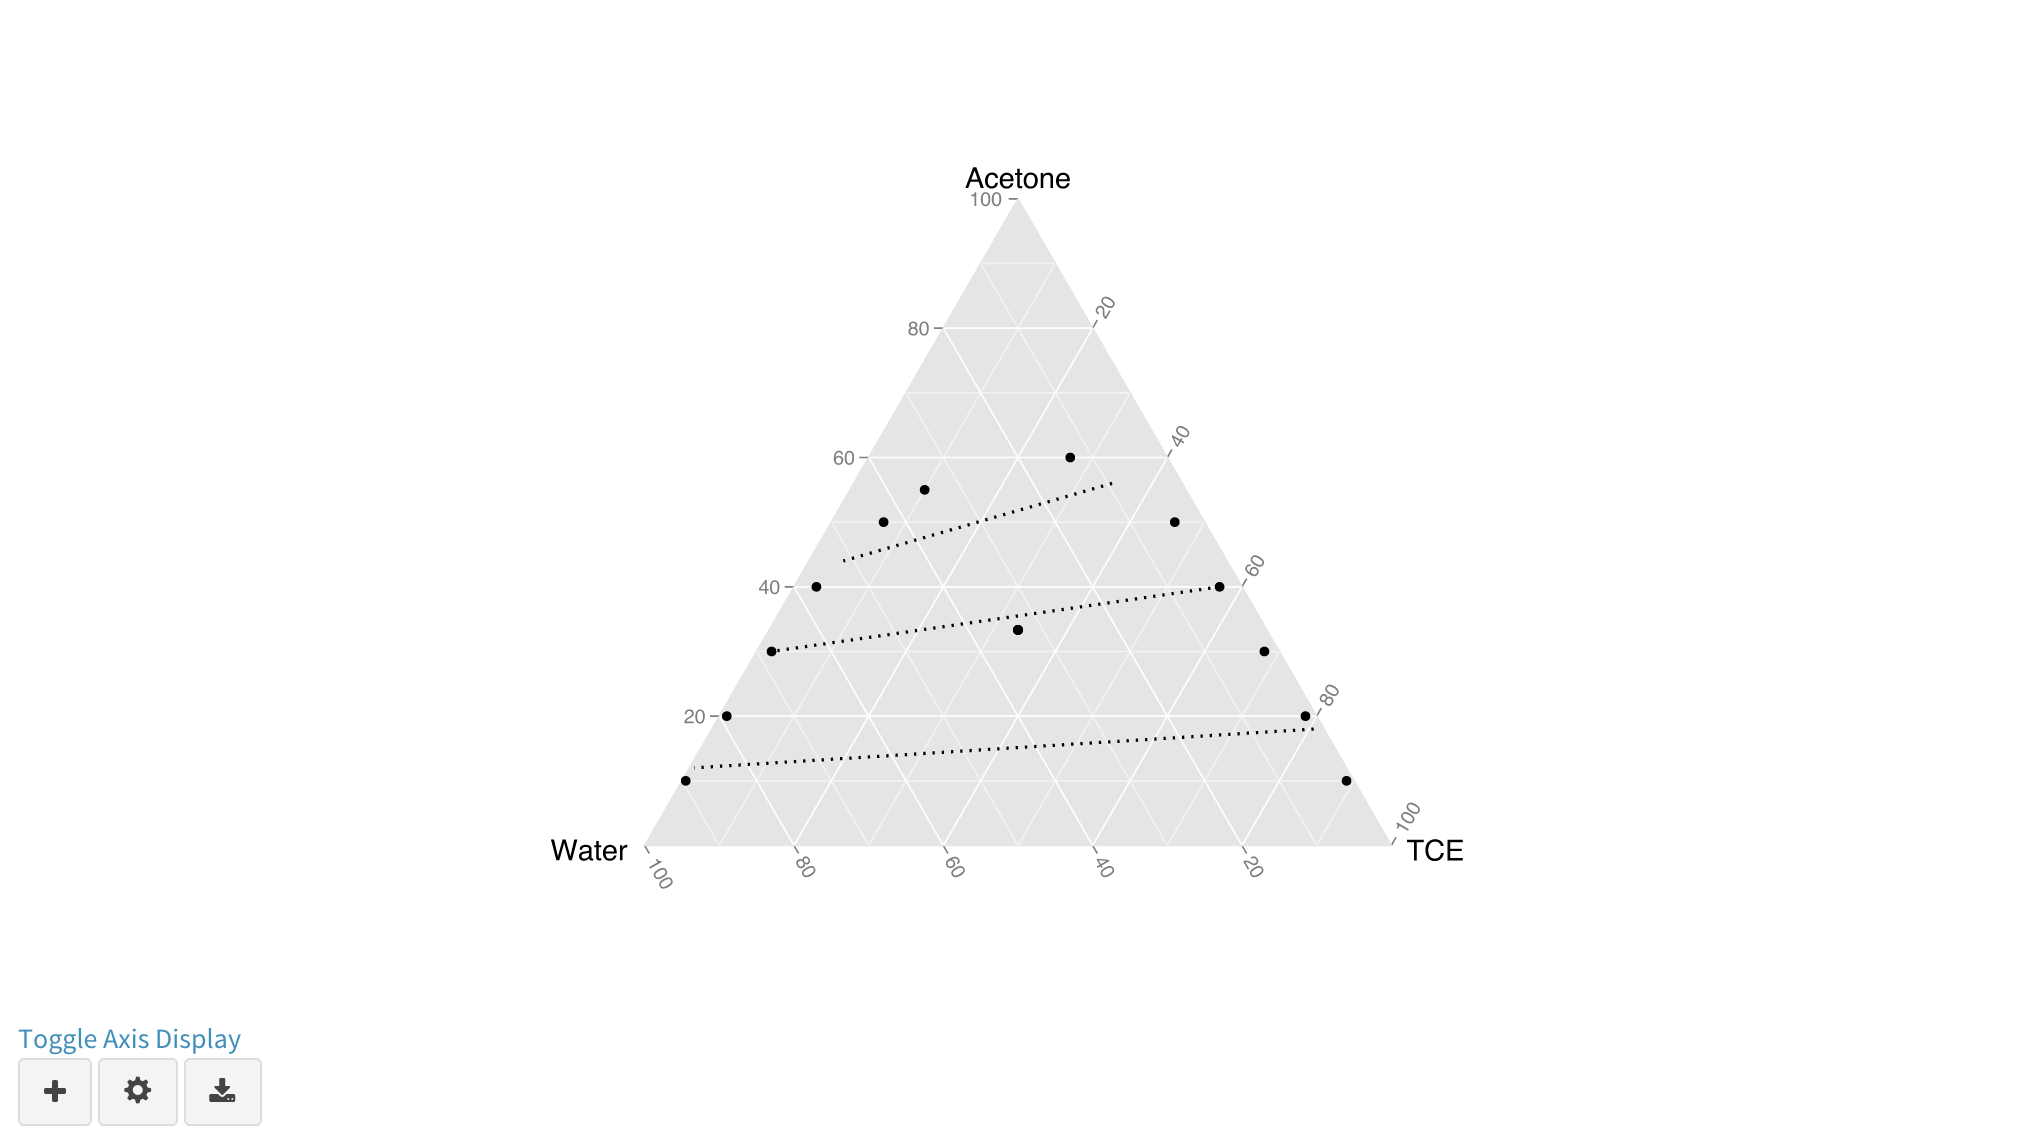
Ternary Plot
- Toggle Axis: only enabled once equilibrium data is uploaded
- Add Option: additional points can be added with their corresponding labels by entering data and pressing graph
- Graph Elements: point size, line thickness, and overall theme are customizable
- Download: save plot as pdf (preserves overall quality)
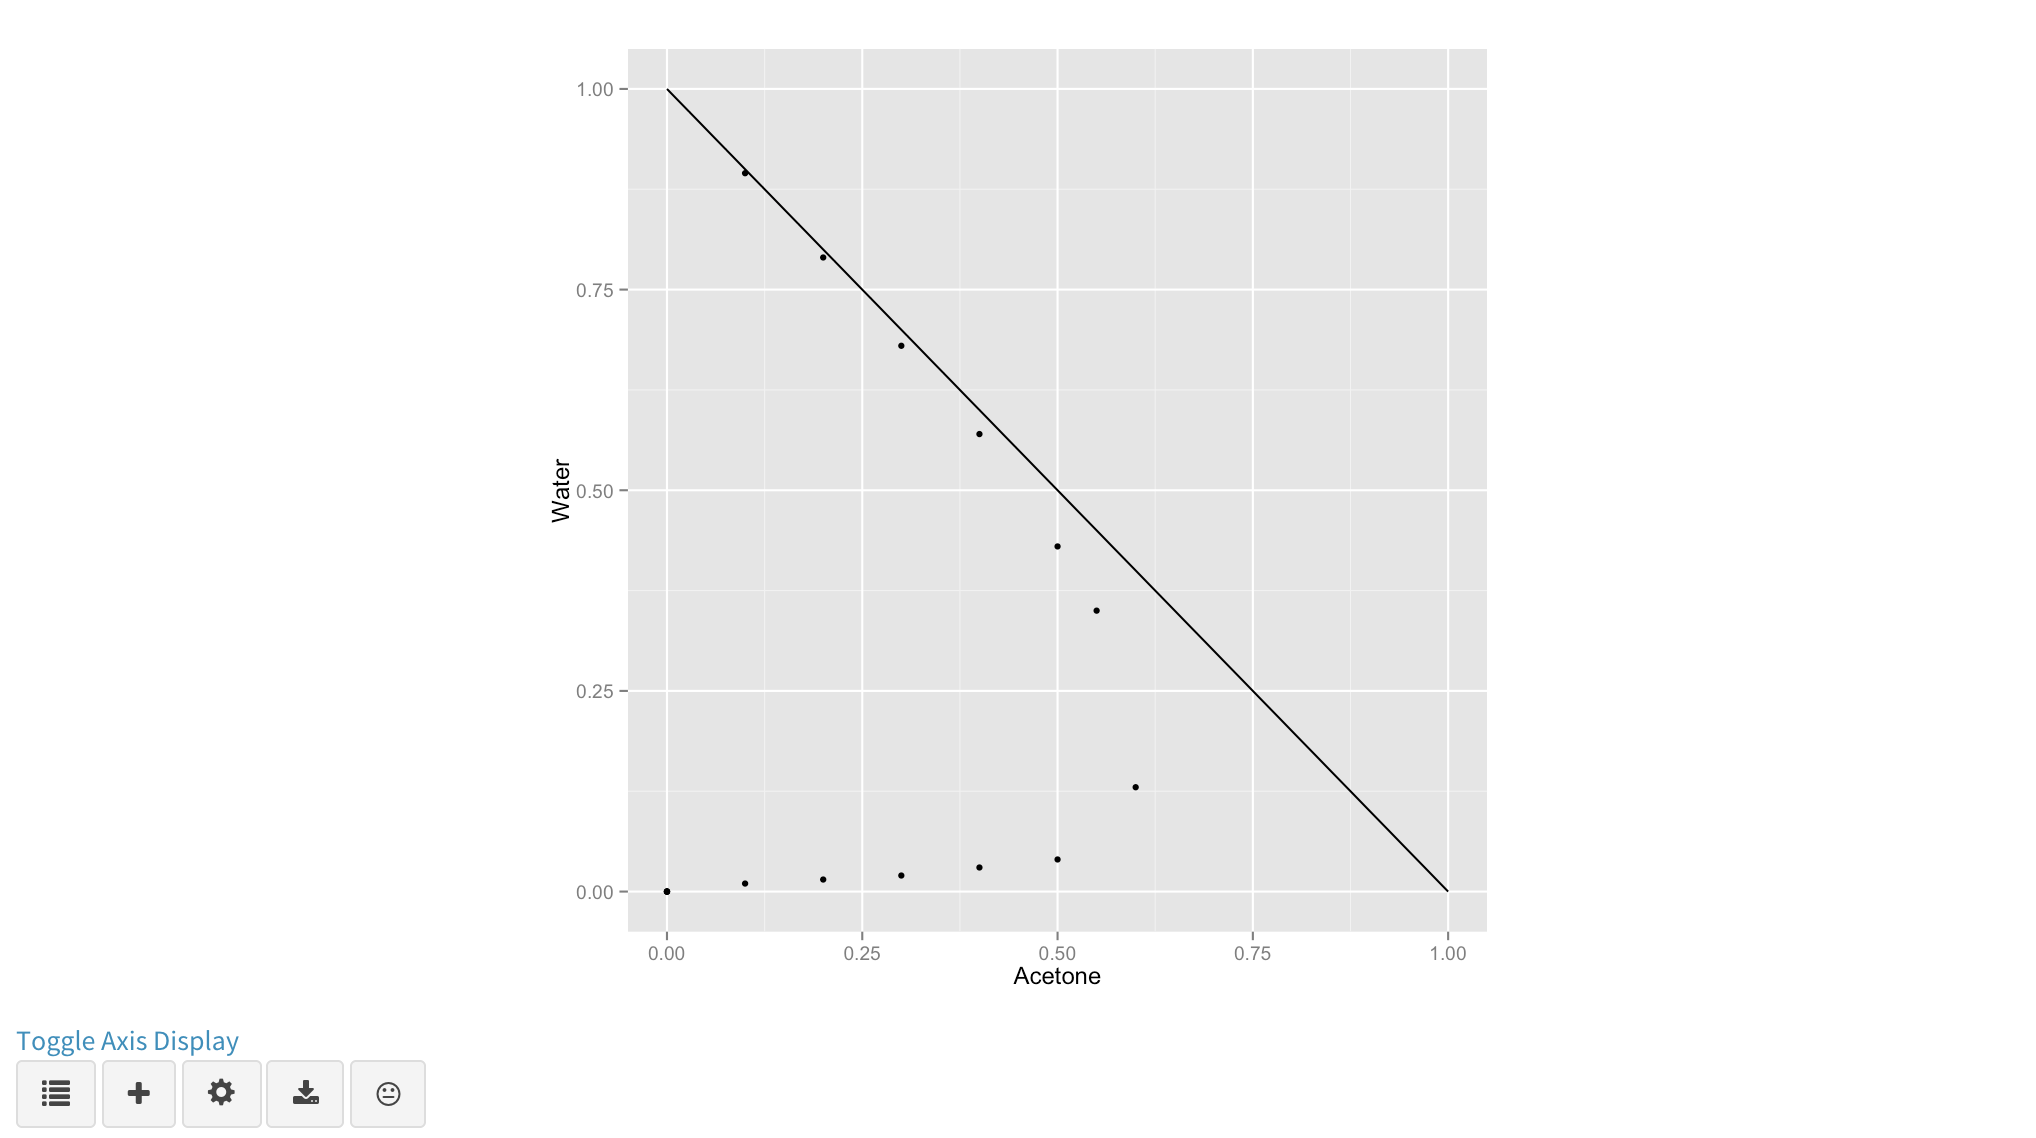
Right Triangular Plot
- Toggle Axis: only enabled once equilibrium data is uploaded
- Choose Components: allows you to choose what components to plot on the x and y axis
- Add Option: additional points can be added either by entering data manually or double clicking the plot itself (cycles through points)
- Graph Elements: point size, line thickness, and overall theme are customizable
- Download: save plot as pdf (preserves overall quality)
- Plot.ly: open plot using plot.ly API